mlb umpiring data project
assignment
Create at least five different data visualizations centered on a topic of your choice
description
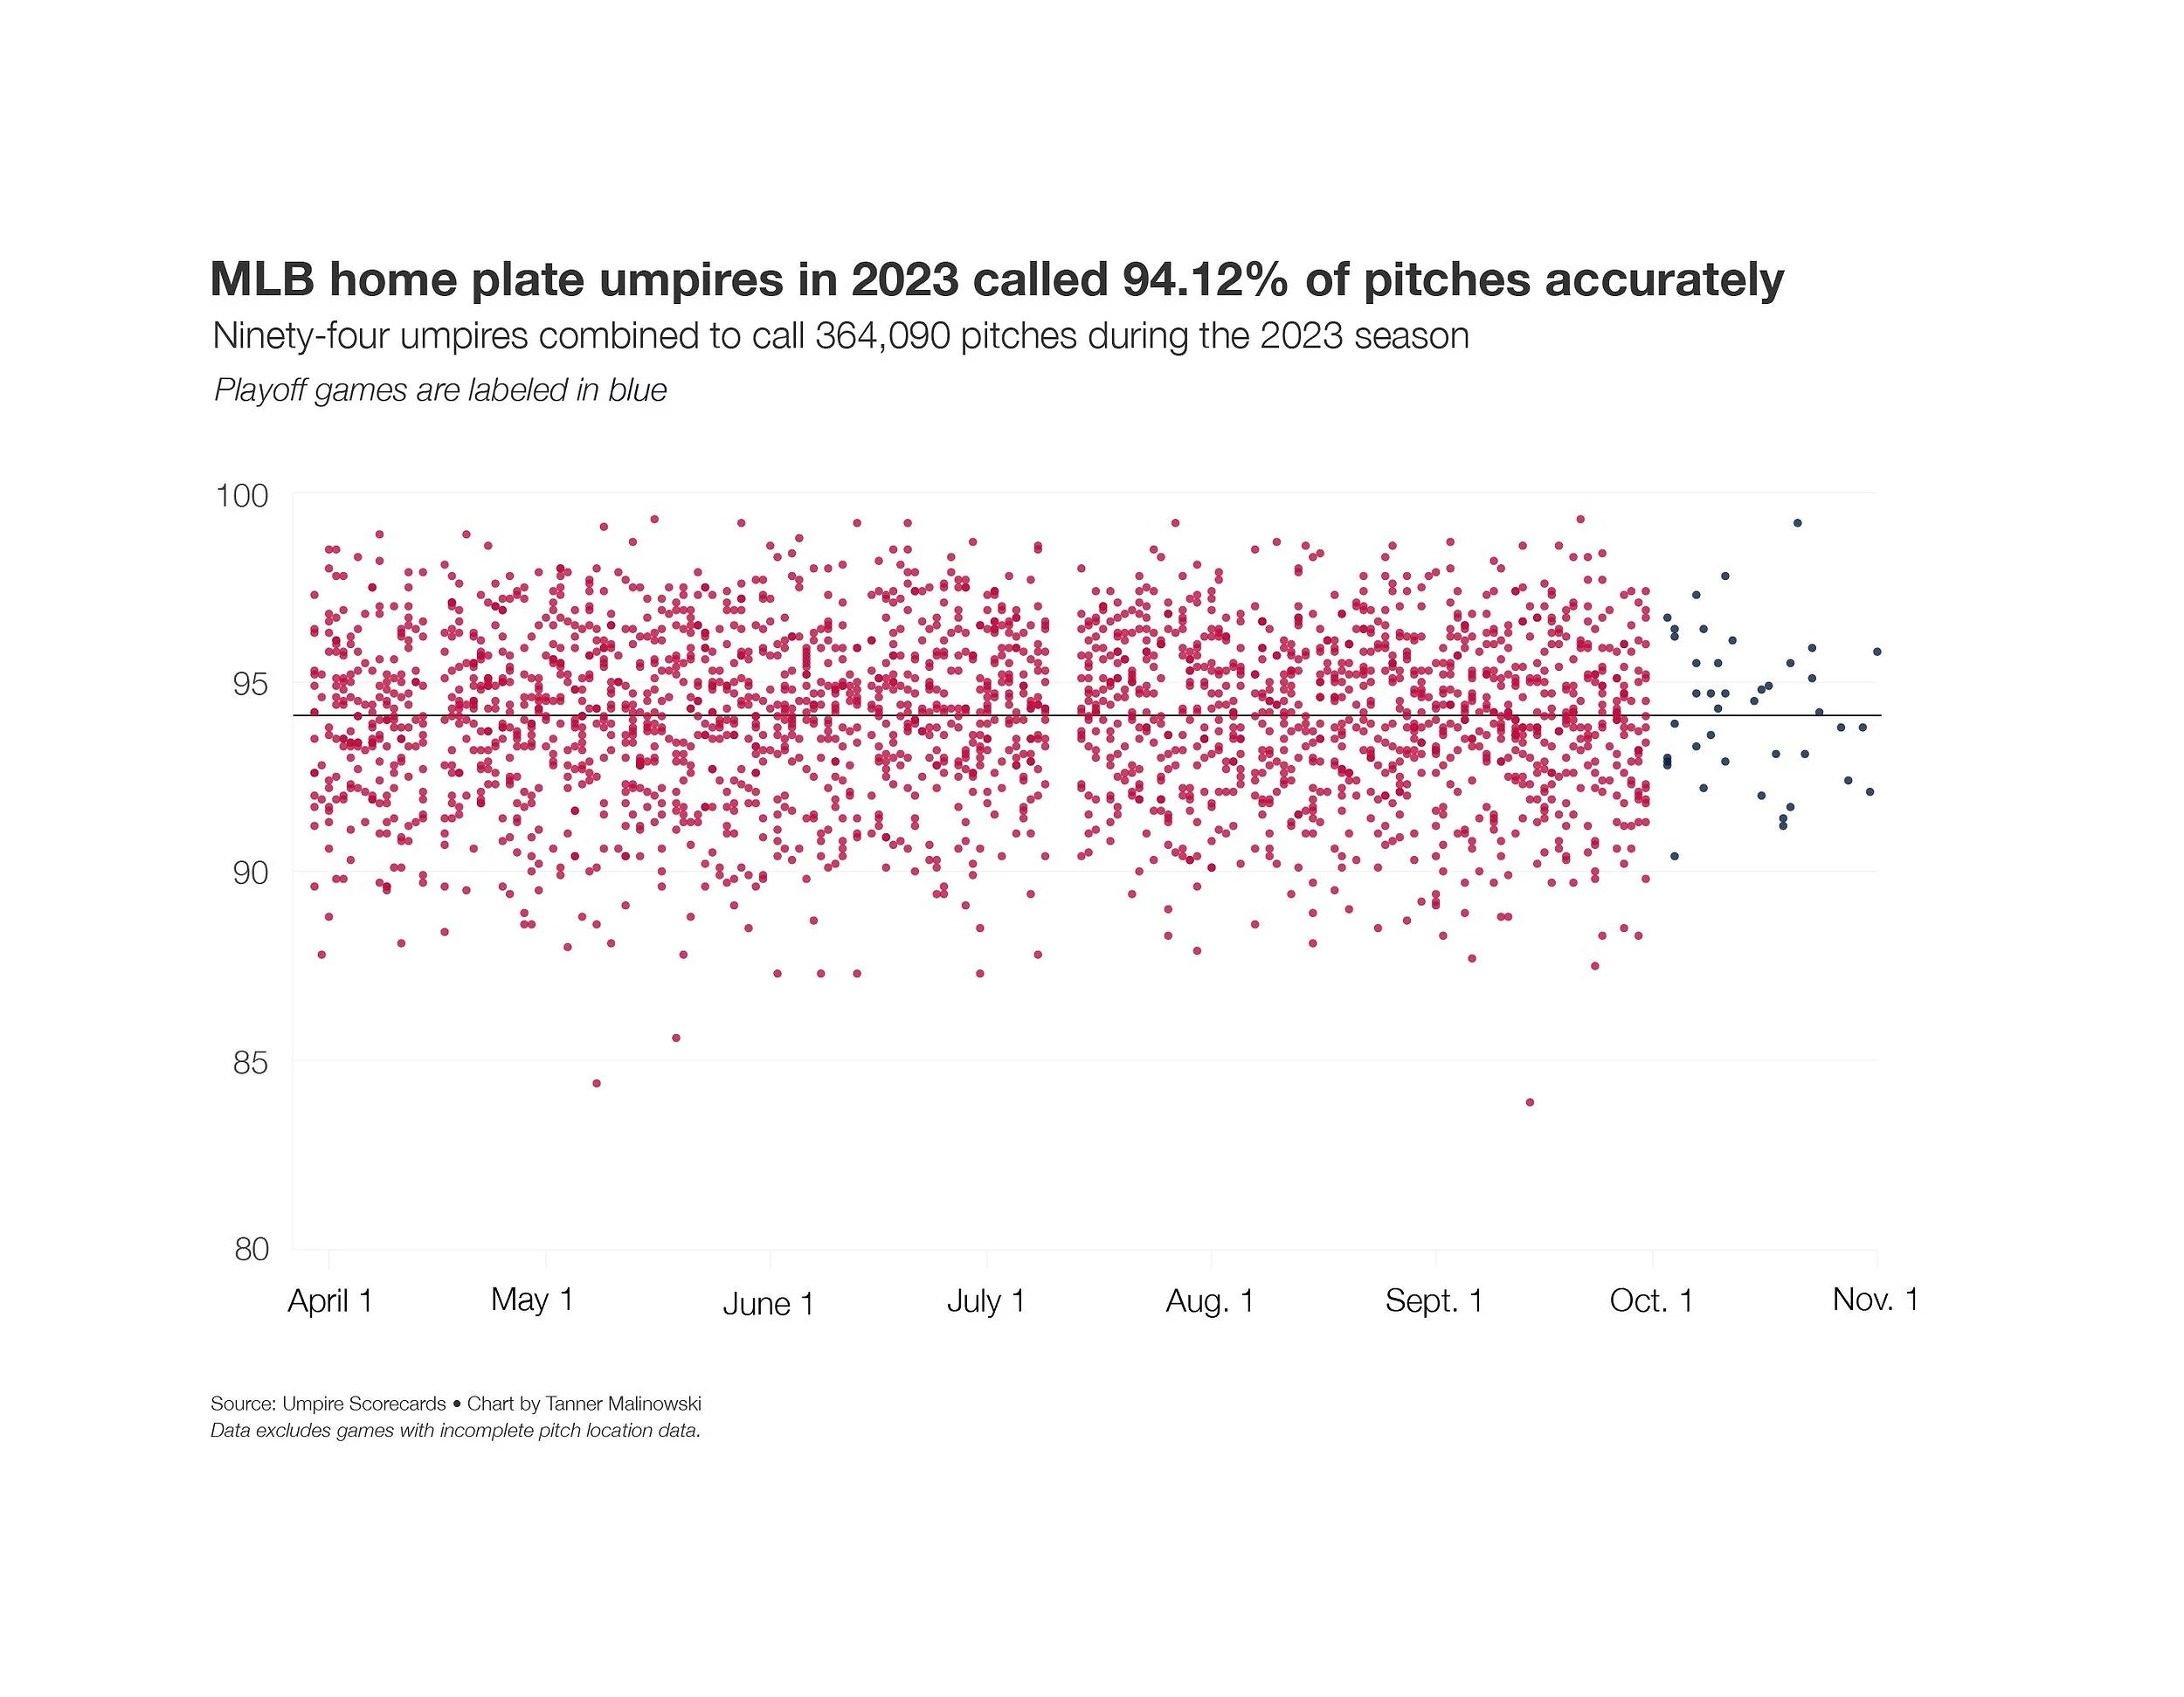
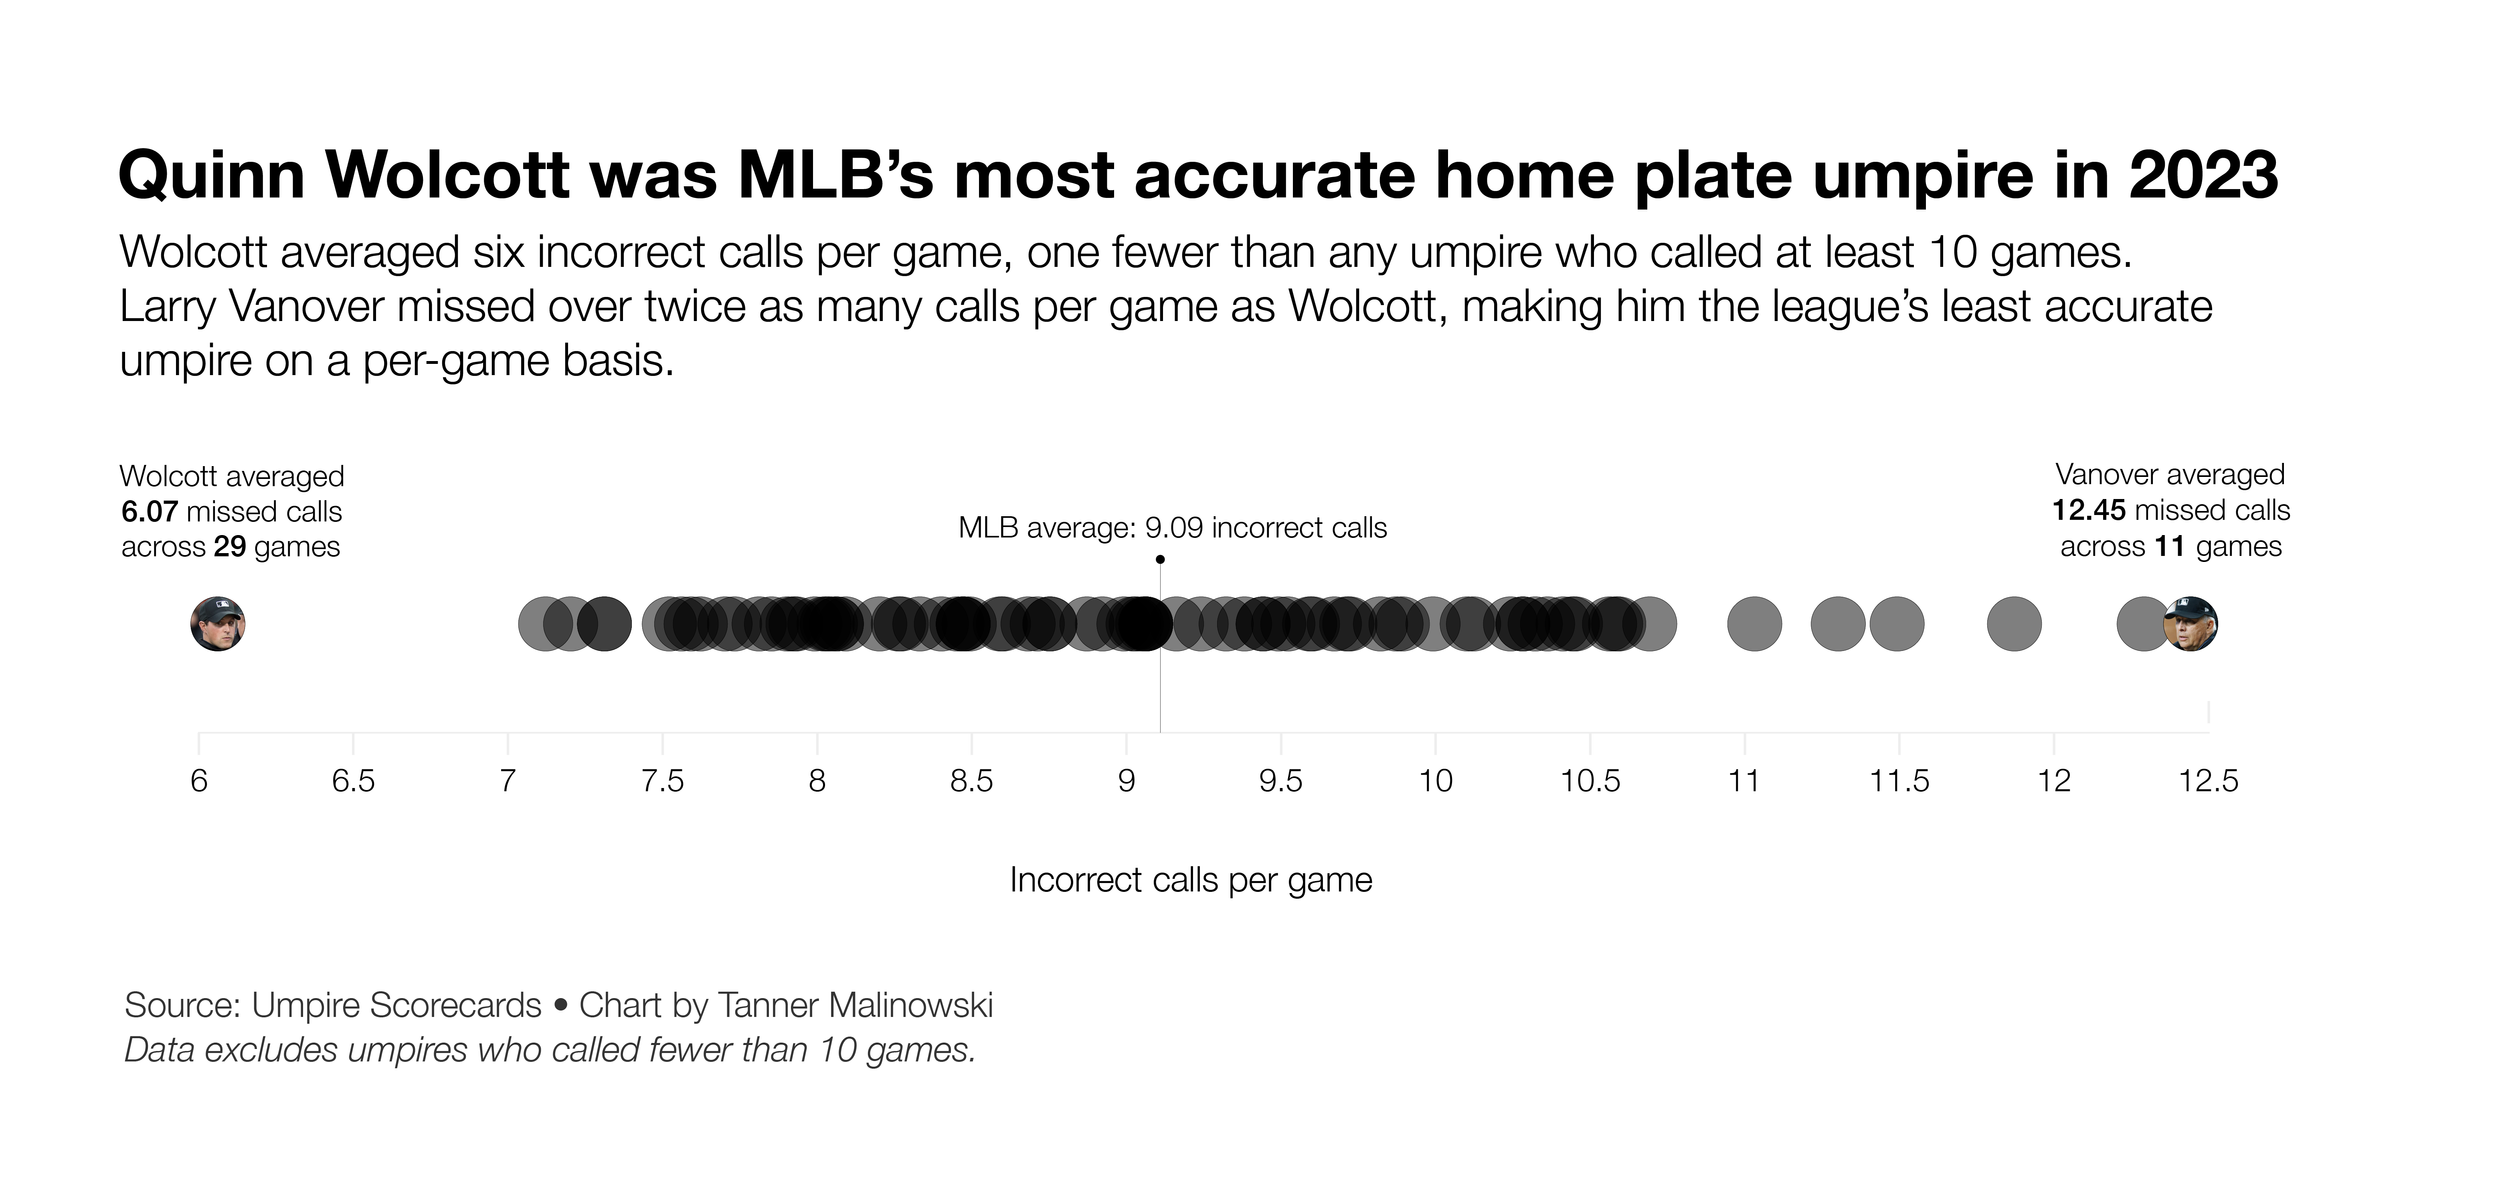
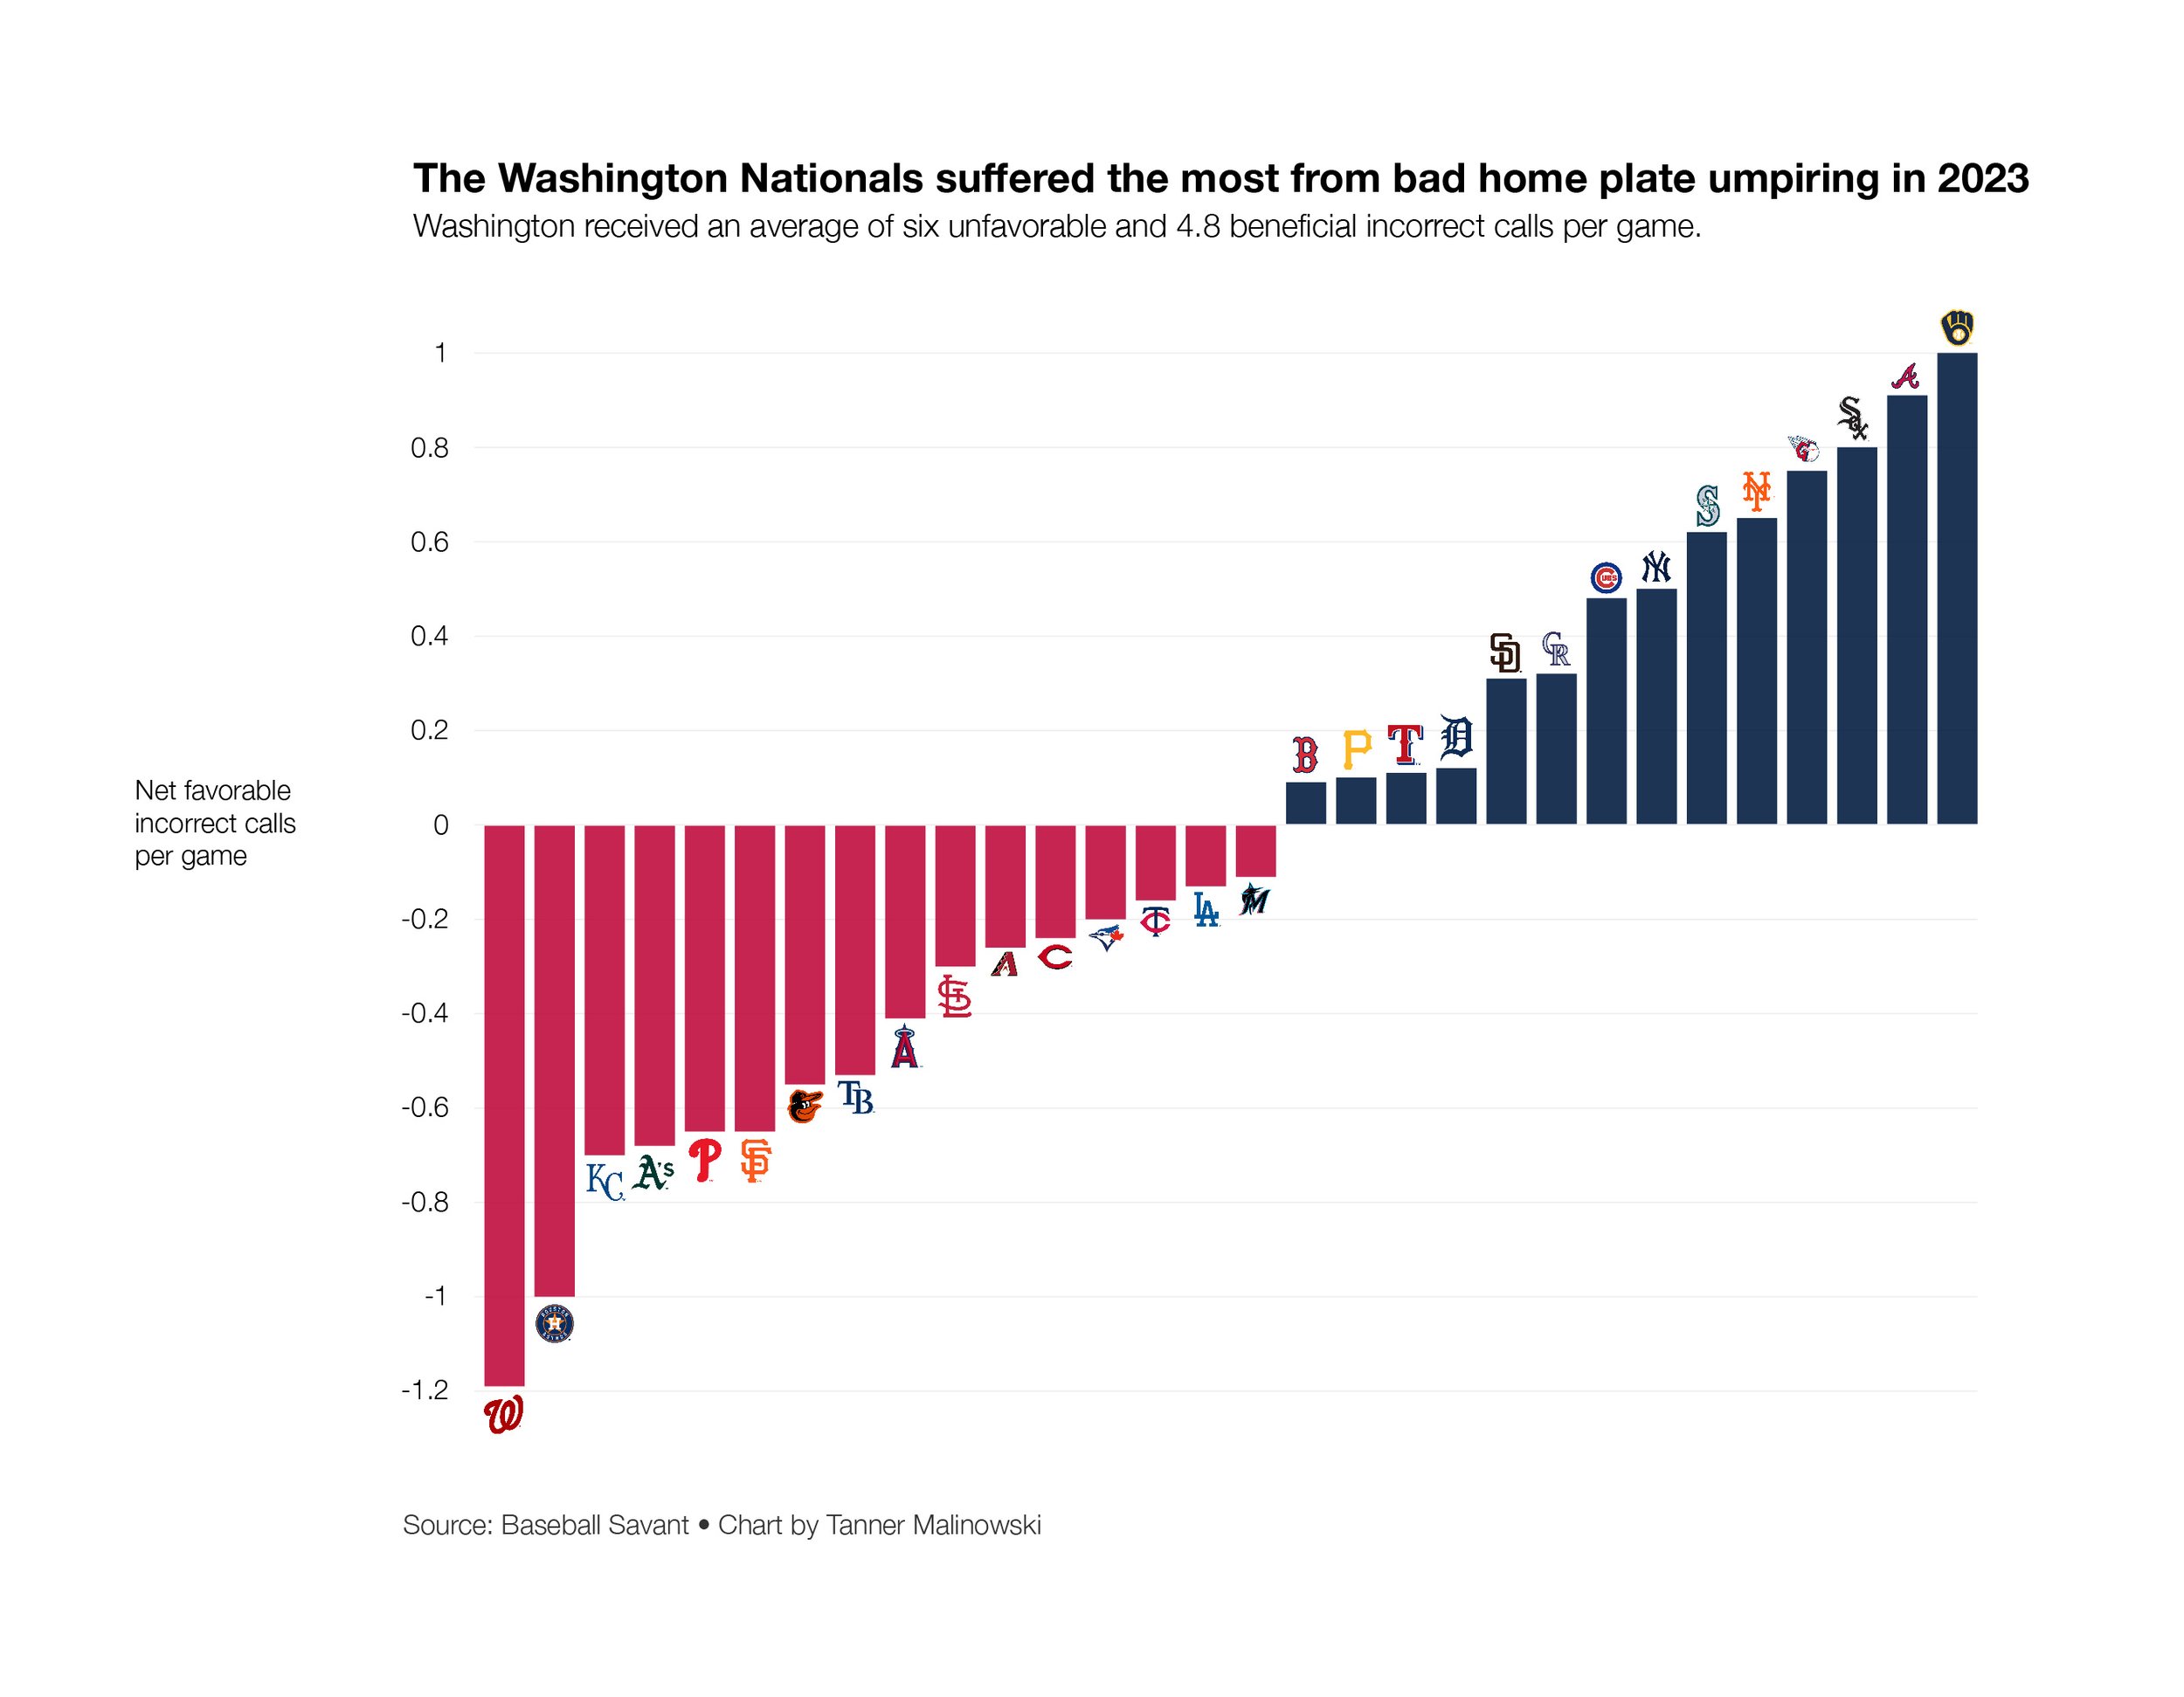
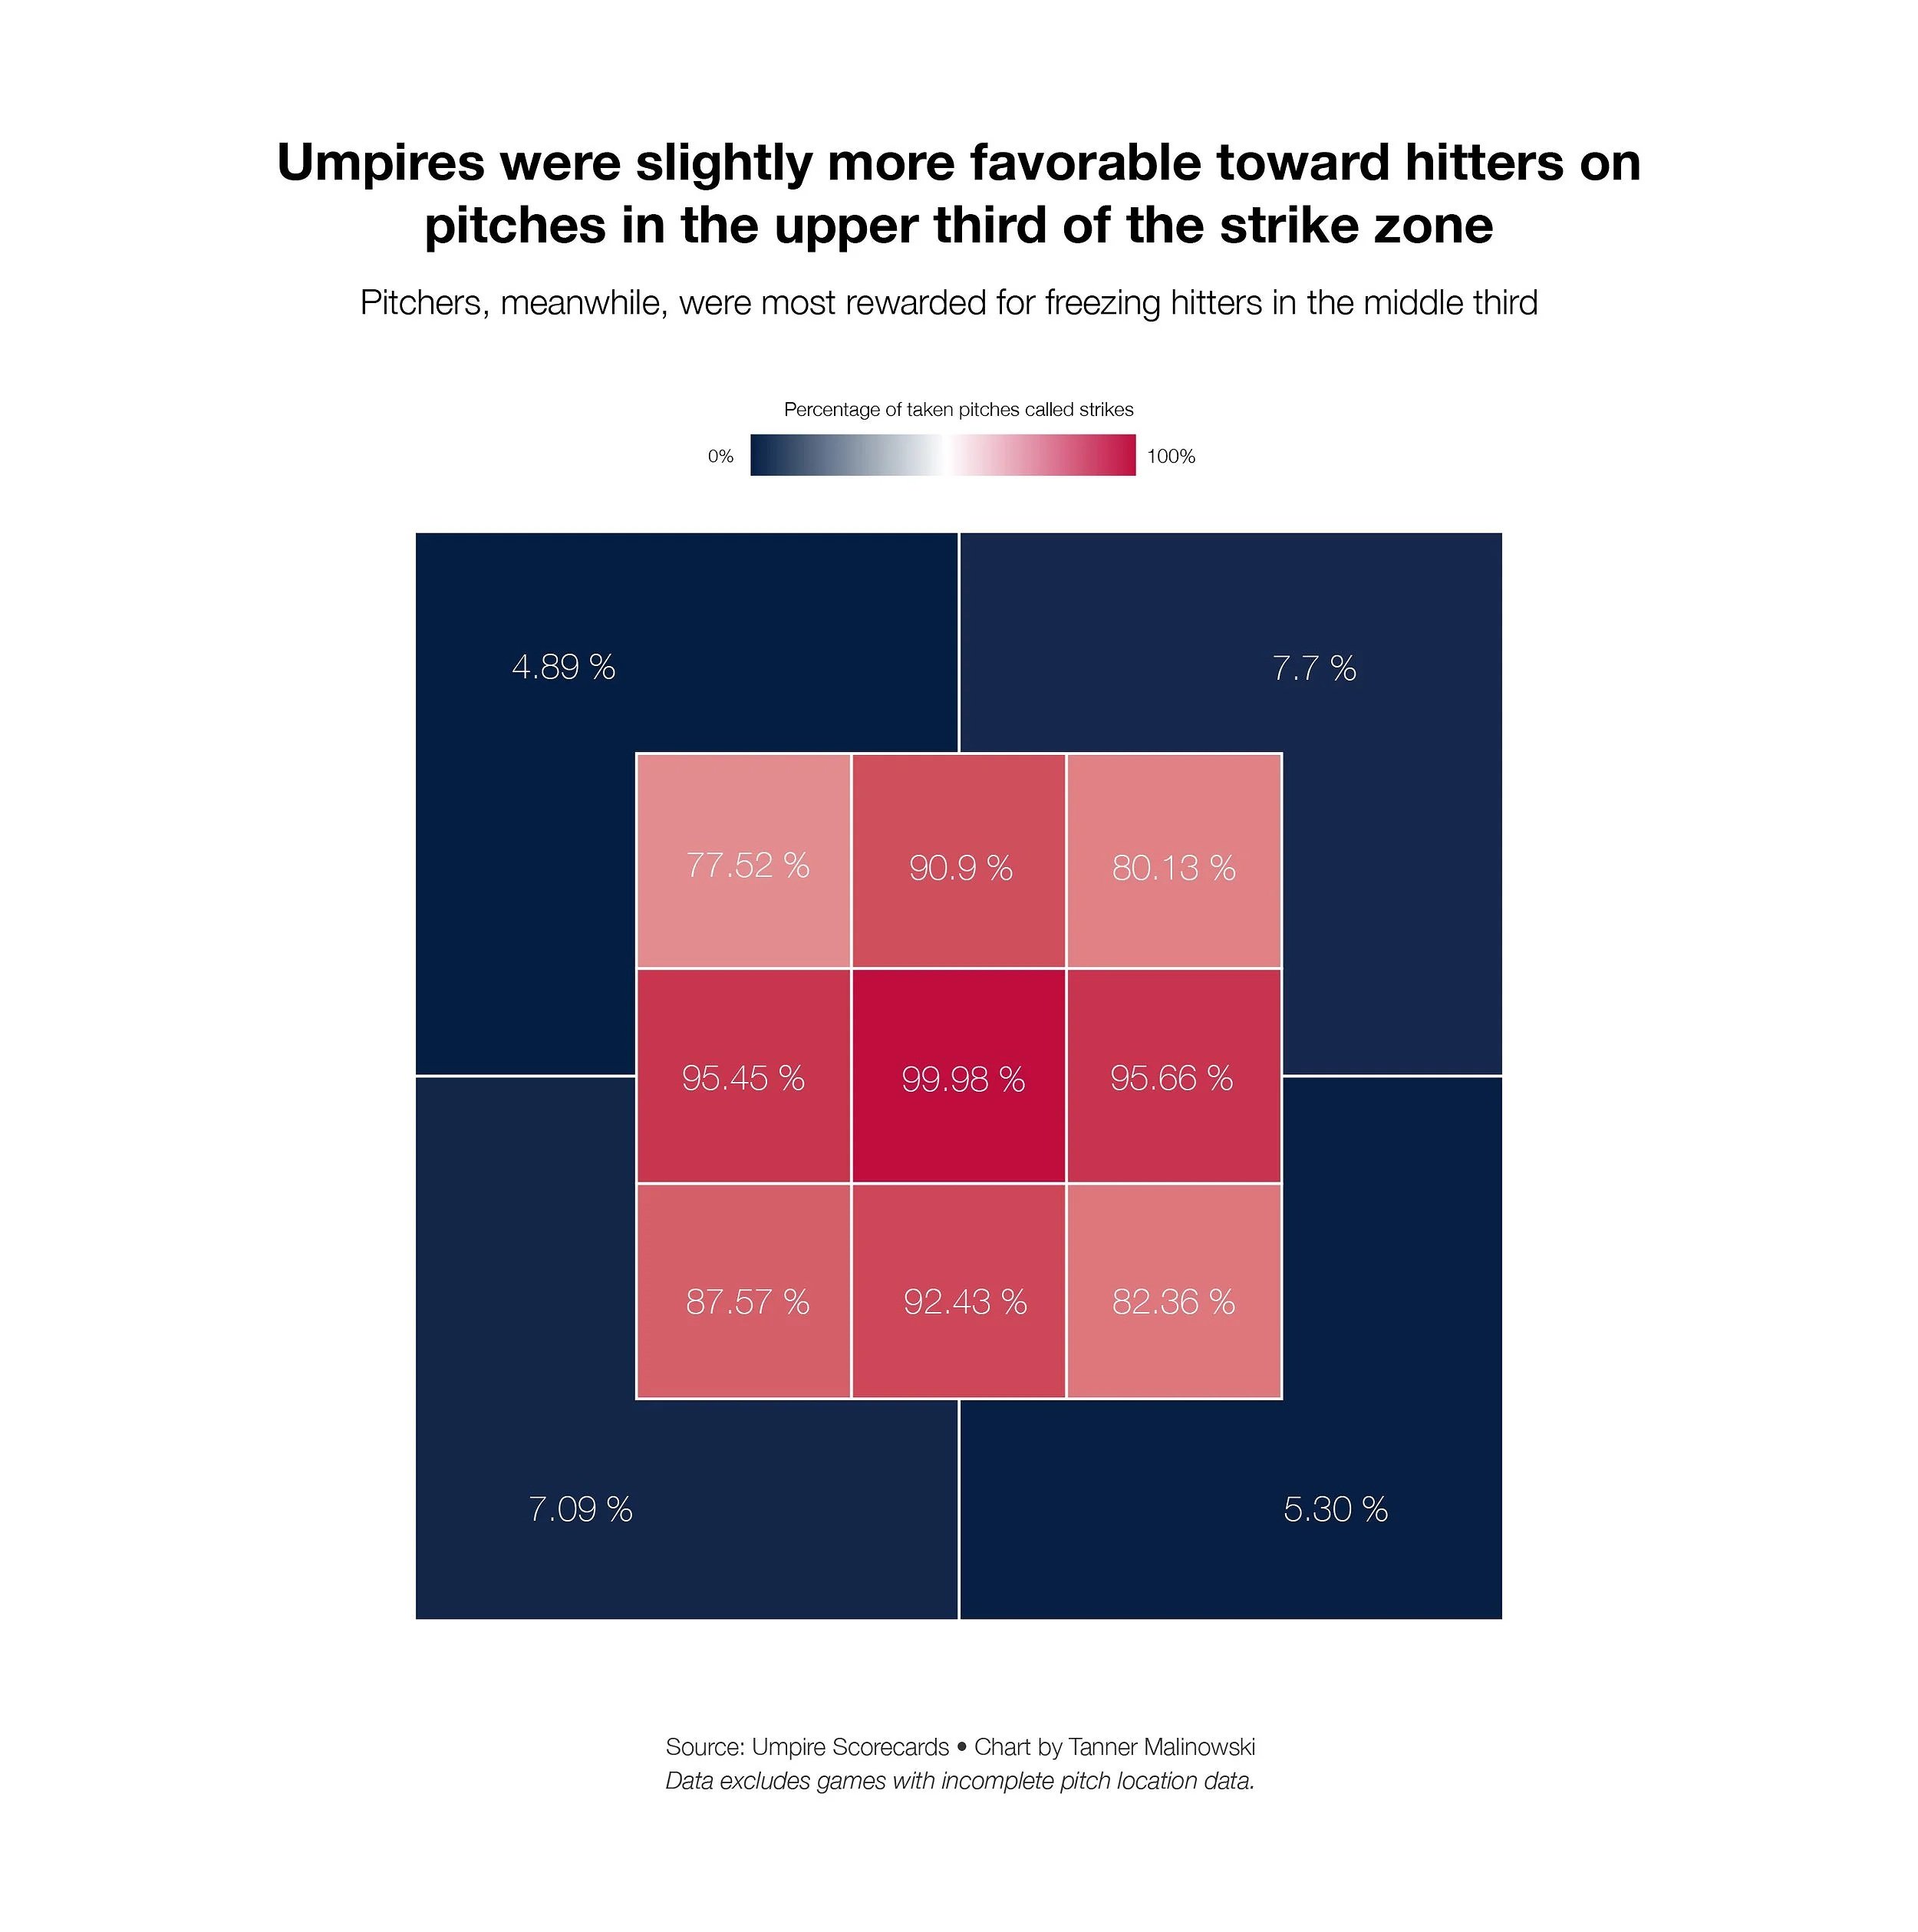
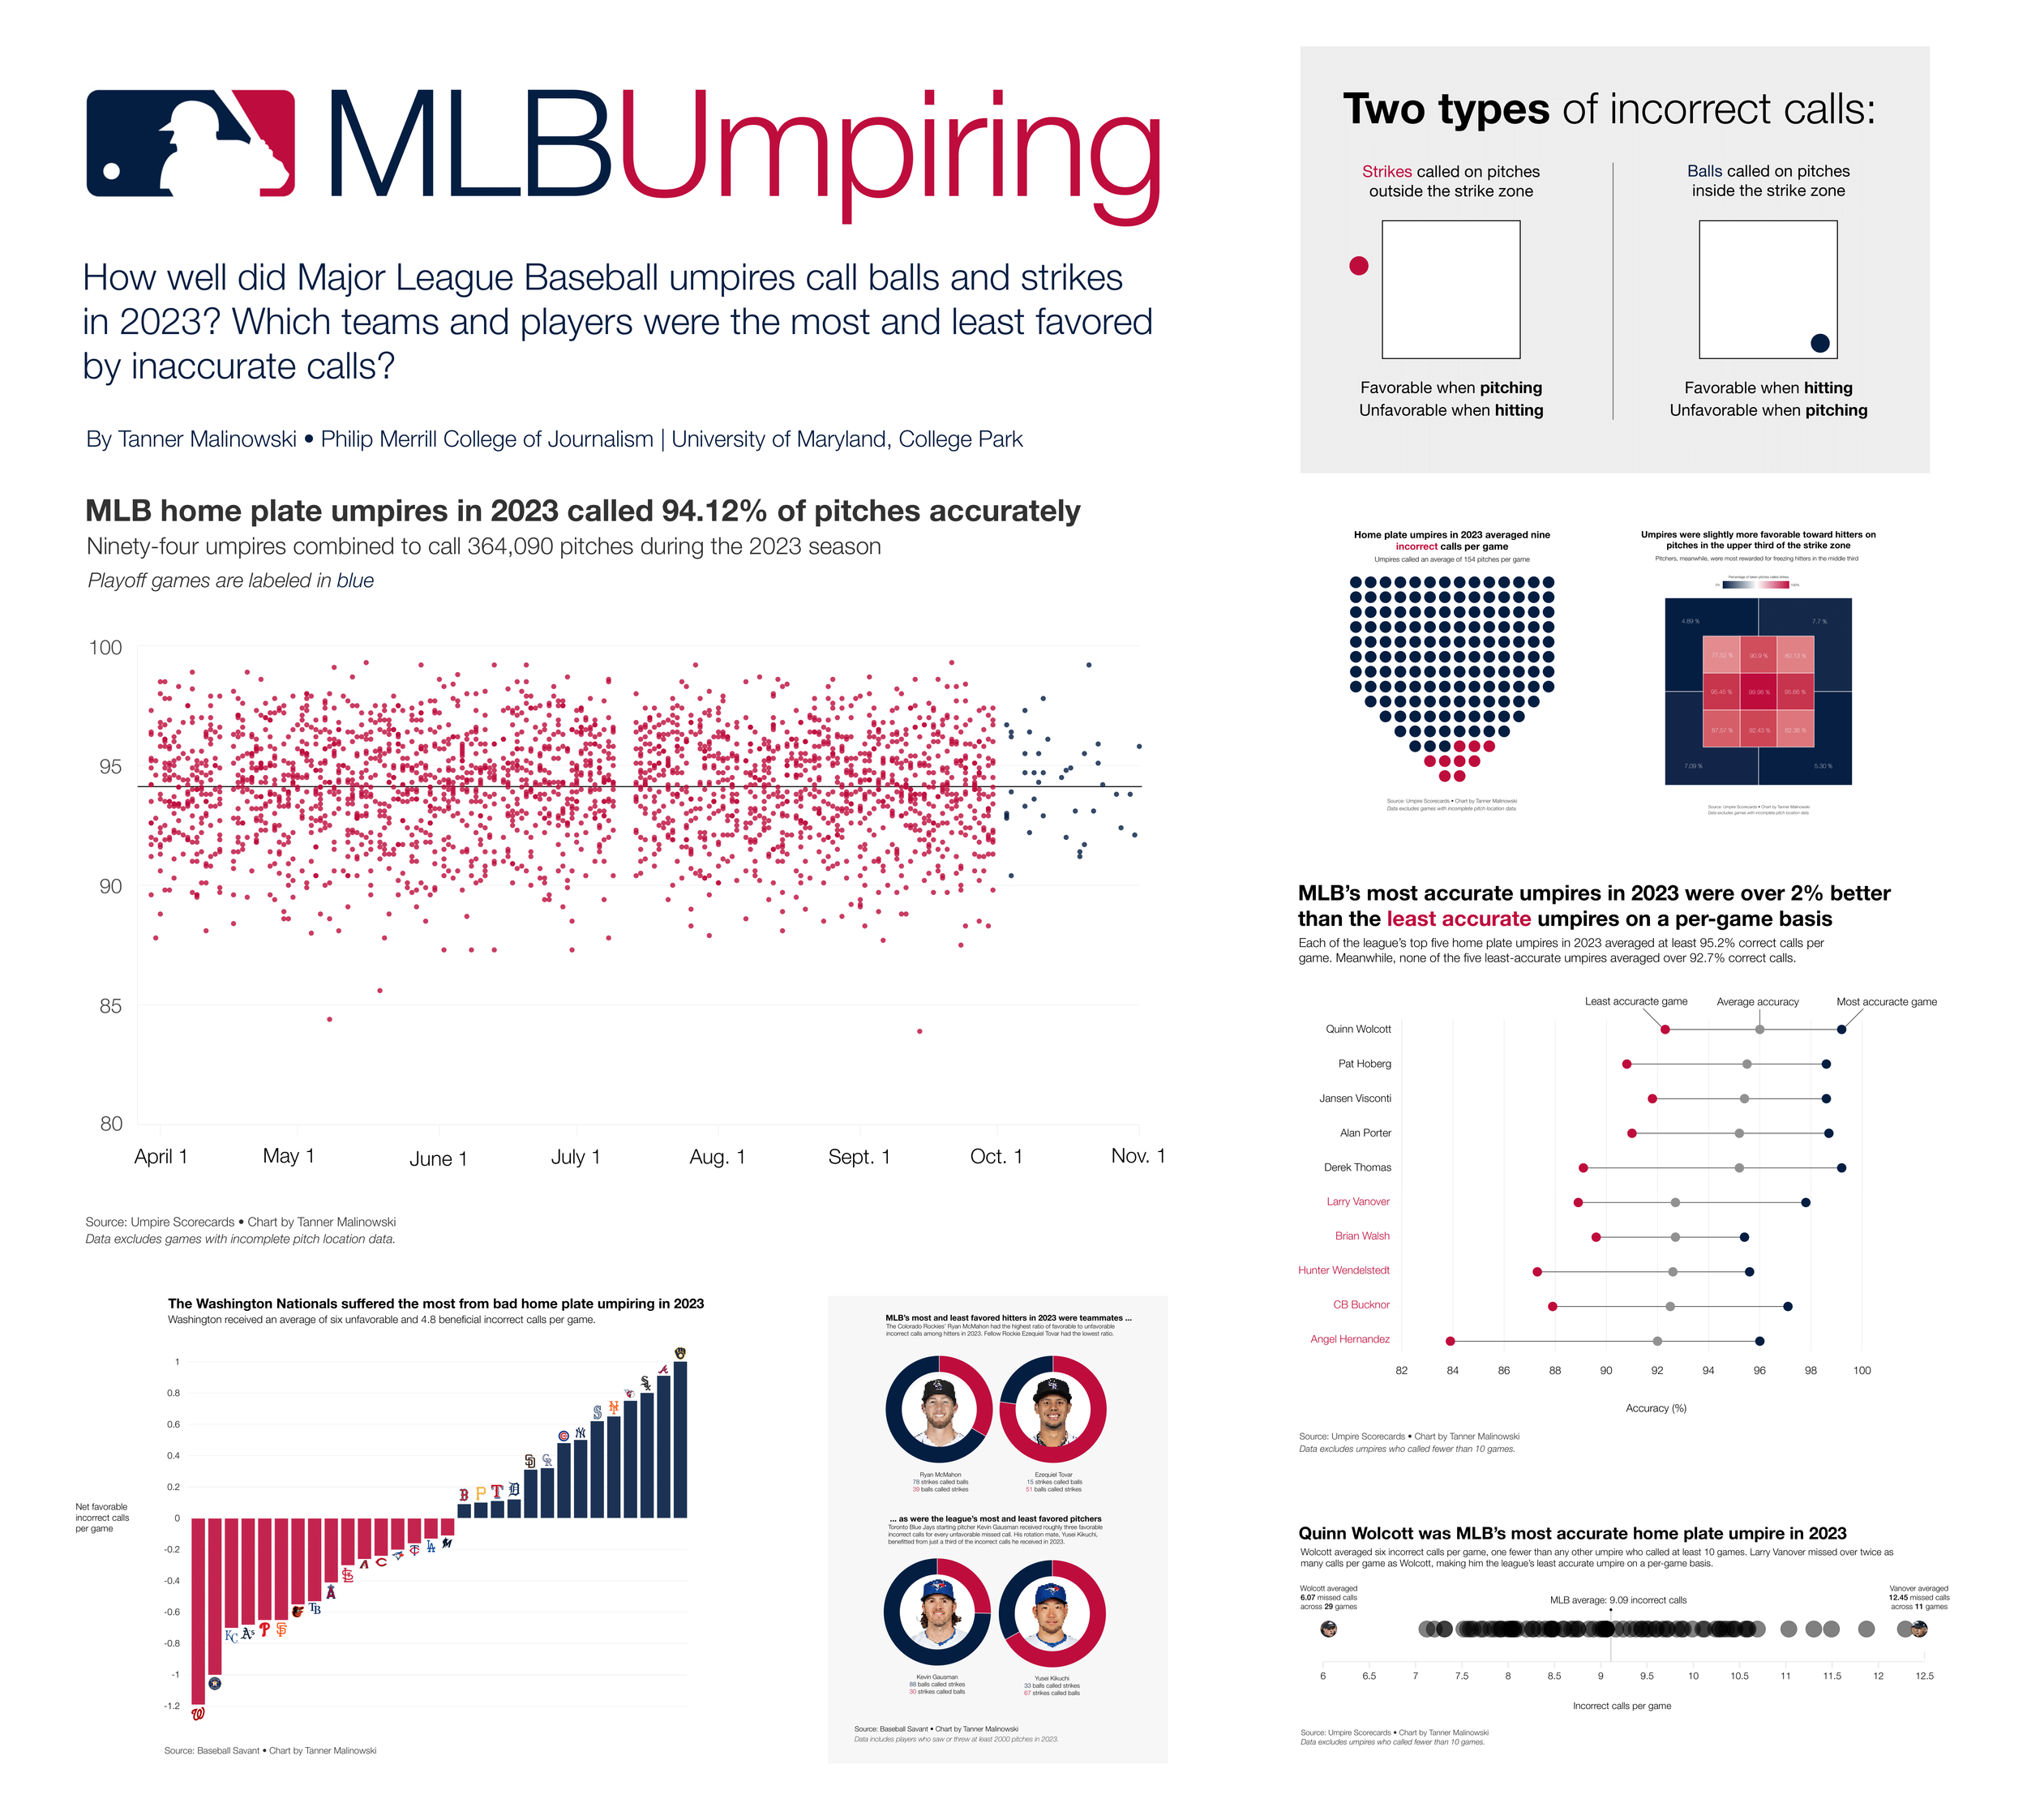
I built each chart in either Flourish and Datawrapper before exporting it to Illustrator to add annotations and customize its appearance.
While each graph displays a unique chunk of data tailored to a specific question, the color scheme and typography remain consistent throughout the project and contribute to a unified theme that is professional, yet inviting.